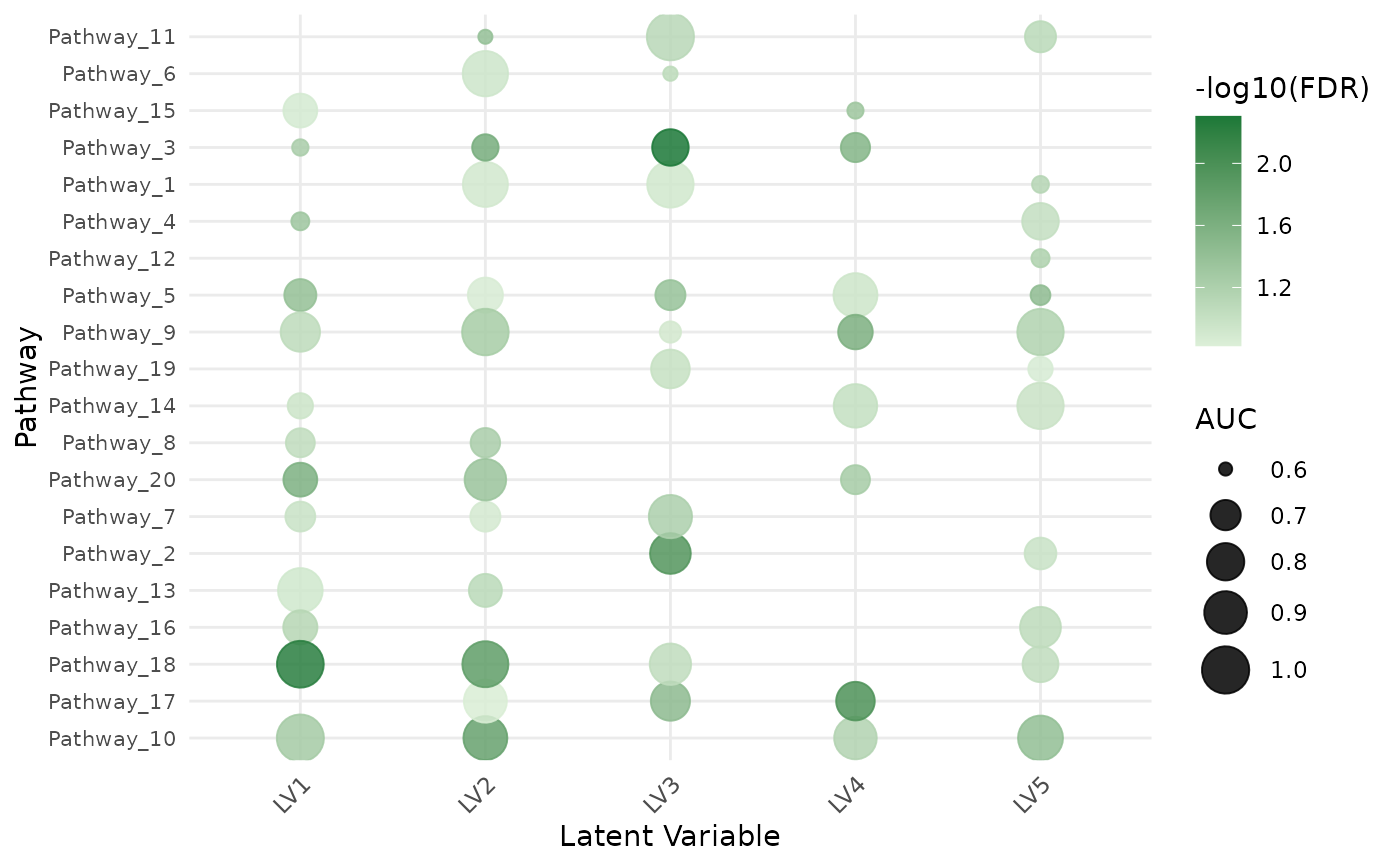
Dot plot of pathway-LV associations across all latent variables
Source:R/plots.R
CLAMPdotplotAll.RdProduces a dot plot where each point represents one pathway × LV pair.
Dot size encodes the AUC value and dot colour encodes -log10(FDR). Only
associations passing auc.cutoff and fdr.cutoff are shown.
CLAMPdotplotAll(
  clampRes,
  auc.cutoff = 0.6,
  fdr.cutoff = 0.05,
  top.per.lv = NULL,
  max.name.len = 40
)
Arguments
- clampRes
A CLAMP result list containing a
summarydata frame with columnspathway,LV,AUC, andFDR. Alternatively,clampResmay be the summary data frame itself.- auc.cutoff
Minimum AUC to display. Default
0.6.- fdr.cutoff
Maximum FDR to display. Default
0.05.- top.per.lv
Maximum number of pathways to display per LV, chosen by highest AUC.
NULLshows all. DefaultNULL.- max.name.len
Maximum characters for pathway label trimming. Default
40.
Value
Invisibly returns a ggplot2::ggplot() object.
Examples
set.seed(9)
pathways <- paste0("Pathway_", 1:20)
lvs <- paste0("LV", 1:5)
nr <- length(pathways) * length(lvs)

summ <- data.frame(
    pathway = rep(pathways, length(lvs)),
    LV = rep(lvs, each = length(pathways)),
    AUC = runif(nr, 0.5, 1.0),
    FDR = runif(nr, 0, 0.2),
    stringsAsFactors = FALSE
)

CLAMPdotplotAll(list(summary = summ), auc.cutoff = 0.6, fdr.cutoff = 0.15)